The Utilization Report: Conference Championship
Volume is king in fantasy football, and this report will help you understand which players are due more or less according to their roles.
Volume is king in fantasy football, and this report will help you understand which players are due more or less according to their roles. It is a great way to know who is overperforming (sell high) and underperforming (buy low) based on historical data tied to metrics we know drive volume.
- Overall offense: Which teams are enabling winning volume and efficiency across game scripts
- Quarterbacks: How involved is each QB in the running game, and who is unlocking upside for their weapons
- Running backs: Which backs are handling early downs, short-yardage and passing downs
- Tight ends: Who is running enough routes and meeting critical targets per route thresholds
- Receivers: Which receivers are in the most routes and operating broadly within the offense
For this season, Fantasy Life has partnered with PFF to collaborate on the Utilization Report.
Get access to the full Utilization Report, all the data tables, and team-by-team analysis by subscribing to PFF+
Divisional Round Takeaways
Upgrades
WR – DeVonta Smith
Smith pulled even with A.J. Brown in target share (28%) thanks to a dominant 43% outing against the Giants. He secured six of 10 targets for 61 yards and a TD in a game where the Eagles didn’t need to throw much.
| Smith is a low-end WR1 with high-end WR1 upside. | WR – Kadarius Toney | Travis Kelce | Deebo Samuel | Justin Watson | For now, Toney is a boom-bust WR3 with WR2 upside. | TE – Hayden Hurst | Ja’Marr Chase | Tee Higgins | Tyler Boyd | Hurst has a low-end TE1 profile. | Downgrades | RB – Christian McCaffrey | Elijah Mitchell | CMC is the top RB option heading into the Conference Championship Weekend, but he isn’t the every-down back we have grown used to over the years. | WR – Tee Higgins | Brandin Cooks | JuJu Smith-Schuster, | Corey Davis | Higgins drops to low-end WR2 territory and is toeing the WR3 line. | WR – JuJu Smith-Schuster | Patrick Mahomes | The sixth-year slot receiver profiles as a high-end WR3 thanks to the offense, but his talent profile is in the low-end WR3 range. | Monitoring | RB – Jerick McKinnon | Isiah Pacheco |
|---|---|---|---|---|---|---|---|---|---|---|---|---|---|---|---|---|---|---|---|---|---|---|---|---|---|
| 16 | 47% | 25% | 61% | 12% | 16% | 0% | 0% | 78% | 0% | 12.8 | |||||||||||||||
| 17 | 48% | 13% | 43% | 15% | 32% | 60% | 0% | 100% | 100% | 22.6 | |||||||||||||||
| 18 | 36% | 8% | 44% | 13% | 23% | 40% | 0% | 80% | 100% | 8.6 | |||||||||||||||
| DIV | 65% | 39% | 50% | 0% | 0% | 71% | 50% | 100% | 0% | 2.5 | |||||||||||||||
| YTD | 47% | 20% | 49% | 11% | 19% | 49% | 26% | 90% | 85% | 11.0 |
The veteran RB might be the Chiefs’ preferred option in crunch time, but he didn’t have a target after averaging 5.2 since the Week 8 bye.
We could see Kansas City design more looks for McKinnon next weekend to help out a hobbled Mahomes. However, Mahomes’ inability to move around could allow the defense to play underneath coverage more aggressively.
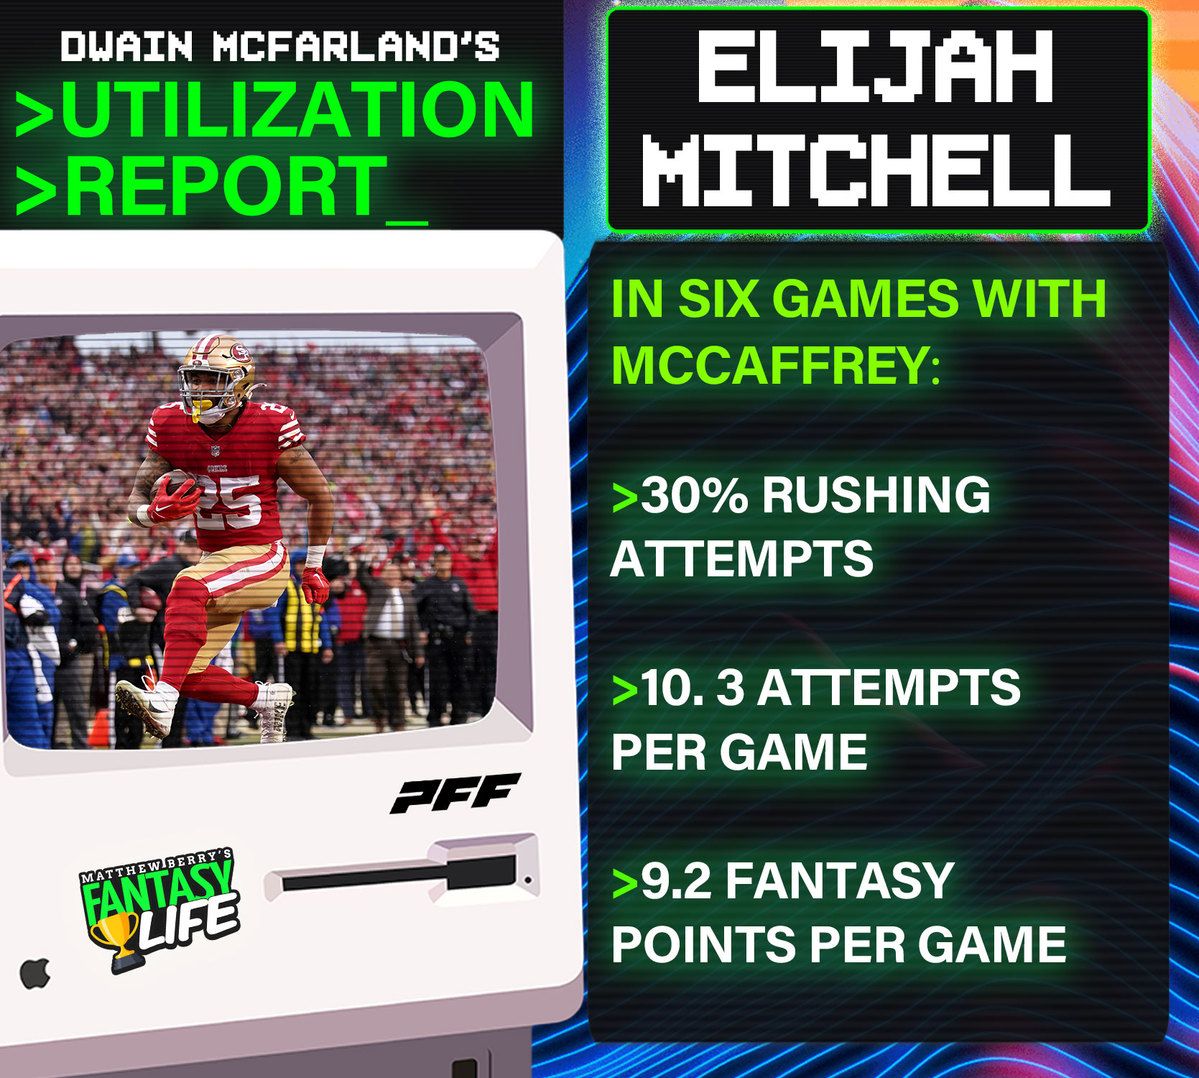
RB – Elijah Mitchell
Mitchell handled 44% of the 49ers’ rushing attempts in the Divisional Round matchup against the Cowboys, tying his season-high mark. He has accounted for 30% of the team’s rushing attempts in games with Christian McCaffrey, averaging 10.3 per game.
The second-year back is hardly in a high-end utilization role, but San Francisco ranks fifth in rushing attempts in non-overtime, and runs the ball above the NFL average in trailing, close, and leading game scripts.
- Trailing by four-plus points: 35% (+3)
- Within three points: 44% (+3)
- Leading by four-plus points: 55% (+4)
This commitment to the ground game and the 49ers’ ability to get into scoring position regularly boosts Mitchell’s outlook despite a limited role. San Francisco’s offense converts 44% of their drives into scores, the second-most in the NFL.
Mitchell is a boom-bust RB2.
RB – Eagles RBs
The Eagles smashed the Giants’ run defense for 268 yards and three TDs. Kenneth Gainwell accounted for a season-high 28% of the rushing attempts, but much of it came in the fourth quarter, where he handled 69% of the RB rushing attempts.
Miles Sanders remains the lead option, but his 49% rushing attempt average means he rarely has 20-touch upside.
TE – Dallas Goedert
Goedert delivered 16.8 fantasy points in his fourth game back from injury. He has target shares of 9%, 19%, 23%, and 22% since returning, and has bested an 85% route participation in each game.
WR – Zach Pascal
Pascal surpassed Quez Watkins in route participation (41%), which wasn’t due to blowout conditions. Pascal registered 44% in the first half, while Watkins was at 22%.
Get access to the full Utilization Report, all the data tables, and team-by-team analysis by subscribing to PFF+
Data notes and acronyms:
- 1st/2nd = First and second downs
- LDD = long down and distance (third and fourth down with three or more yards to go)
- SDD = short down and distance (second, third and fourth down with two or fewer yards to go)
- i5 = inside the five-yard line
- 2MIN = two-minute offense (hurry-up offense)
- Close = score within three points
- Lead = leading by four points or more
- Trail = trailing by four points or more
- Plays = penalties included for utilization splits and rates
- Pass Play = all dropbacks (i.e., attempts, sacks and scrambles)
- ADOT = average depth of target
- Air Yards = ADOT multiplied by targets
- TTT = average time to throw
- PA = play action
- PA Targets = percentage of player's targets that came using play action
- Fantasy finishes = through Sunday night game
- YPRR = yards per route run
- TPRR = targets per route run
- EZ = end zone
- TOP = Time of possession
- Pass vs. Run Splits = based on the percentage of time a team throws or passes
- FAB = Free agent budget (based on home leagues; adjust percentages in more competitive formats)

Get $25 Guillotine League Credits When You Join FL+
Lorem ipsum dolor sit amet, consectetur adipiscing elit. Nunc tinciedunt, ex sit amet cursus gravida, dui mauris vulputate felis.